Across the Real Estate industry, companies are starting to realise the power of data integration that when you’re able to connect all your sources of information, you can glean even more valuable insights into your business. This allows for better decision-making, better processes and ostensibly a serious advantage over the competition.
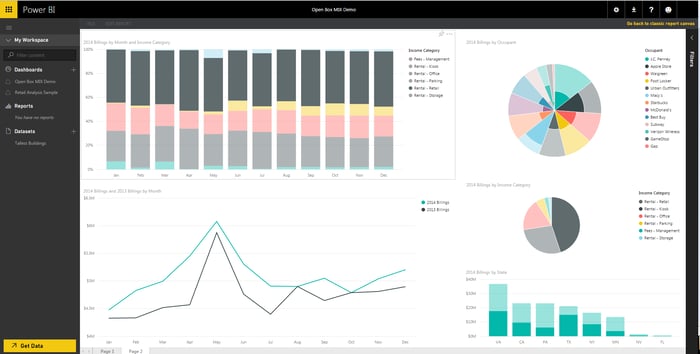
With this in mind, Open Box has been investing a lot of time towards the challenge of data integration. Specifically, the focus is on finding ways to help our clients make the most of their MRI SaaS data. Thankfully, MRI recently released MIX (MRI Information Exchange), which is essentially a tool that lets you design and implement APIs, giving you the power to push and pull data into and out of MRI SaaS. Using this tool, Open Box recently completed a project where they designed APIs for specific functions, securing access to a variety of different banks of data with MRI. And using Microsoft’s Power BI Designer tool, they were able to showcase this data in the most relevant way for the client in this case.
Here’s an overview of the approach:
- First, they developed MIX APIs in MRI’s Toolkit to access a variety of data (everything from occupancy to area of property and financial data). They designed and implemented different APIs for each data source.
- Then they used Power BI Designer to plug into the information from the various APIs. This tool loads data into a model that you can configure to illustrate the data in a relevant visual way. The fact that you can schedule the programme to update data regularly is also a useful function.
- The next step is to connect the data to reveal valuable insights. Within Power BI, you have the ability to manage the relationships between data to build a Data Model. By identifying a common attribute within the data, they were able to associate different data sources and create a Data Model.
- After establishing associations within the Data Model, it’s important to define measurements within your data. Whether it’s relating to time, geographic area, tenant information or income categories (essentially any information that can be aggregated).
- At this stage, you are ready to create a report. Simply choose which data you’d like to overlay and how you’d like to present it visually. Visualization options include bar charts, maps, and pie charts.
- And finally, the client was able to share the results with the relevant people, simply by uploading it to Power BI.

(Please Note: Fictitious data was used for this demonstration, in no way does it represents the actual sales figures of the companies reflected.)
So as this process undoubtedly shows, the technology is available and accessible.
As a partner of MRI, Open Box was invited to speak at one of their user conference in the United Kingdom – a platform which showcases product innovations and new features. With an audience of clients and prospective clients, Open Box presented their competencies in the world of MRI, specifically demonstrating how they built MIX APIs that were consumed by Microsoft’s Power BI. If you’d like to find out more about how this technology could unlock the power of data sharing in your business, please do contact us.
In the Real Estate industry, as in many more across the commercial landscape, companies are starting to acknowledge that the general need to integrate data is not going to go away. If anything, it’s actually likely to increase. The good news is, through this approach, you’ll be able to make information truly relevant and meaningful through integration.


